Can you study class online?
Class position is gaining attention within the social sciences as one determinant of (among many other things) moral behavior and emotional intelligence. Are workers on MTurk diverse enough to participate in this growing body of research? To find out, I aggregated together data collected from five studies measuring MTurk workers' subjective class positions and objective indicators of SES. 1
In this post, I overview MTurk workers'
- subjective class identification
- age and parents' educational attainment
- educational attainment and income
- occupational background and employment status 2
I'll be referring to outside data sources to contextualize my findings, and one popular source of data will be the 2014 General Social Survey (GSS), a nationally representative survey of U.S. residents.
1) Subjective class identification
Respondents often have difficulty reporting their class position (e.g., upper, middle, lower). However, asking respondents to visualize their class position as a rung on a ladder (referred to as a McArthur SES ladder) has been a useful method for inferring how respondents' feel they rank relative to others. This measure has been shown to predict a diverse range of important outcomes even after controlling for objective measures of SES. 3
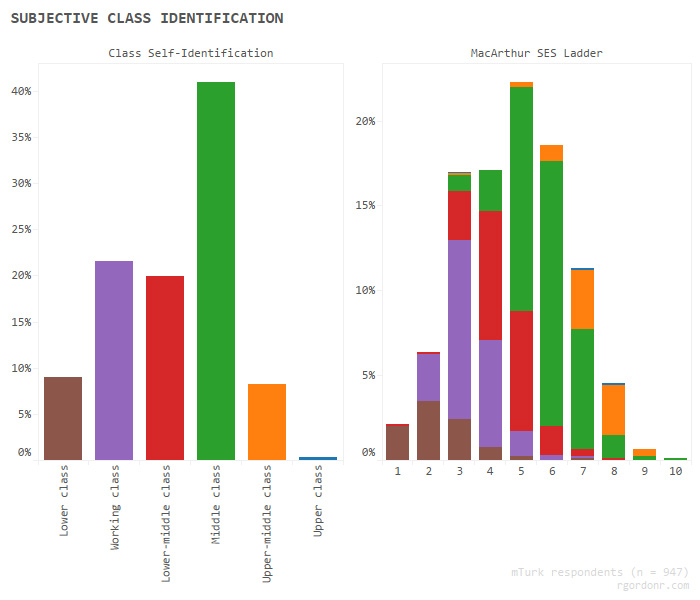
The percentage of lower-class, MTurk respondents in my sample was nearly identical to the percentage found in the GSS (9% vs 9.1%, respectively). The percentage of working-class, MTurk respondents was much lower (21.5% vs 46.1%), however this may have been because, unlike the GSS, I gave respondents the option of selecting "lower-middle class." The percentage of middle-class, MTurk respondents was highly similar to the percentage reported by the GSS (41% vs 42.3%). Perhaps partly due to the inclusion of the "upper-middle class" category, the percentage of upper-class, MTurk respondents was significantly lower than the percentage reported in the GSS (0.3% vs 2.6%).
I am not aware of any nationally representative surveys of U.S. residents that use the MacArthur SES Ladder, so I have little I can compare these data to. However, it's worth noting that the vast majority of respondents saw themselves as somewhere in the middle of the social ladder relative to others, and very few saw themselves at the top.
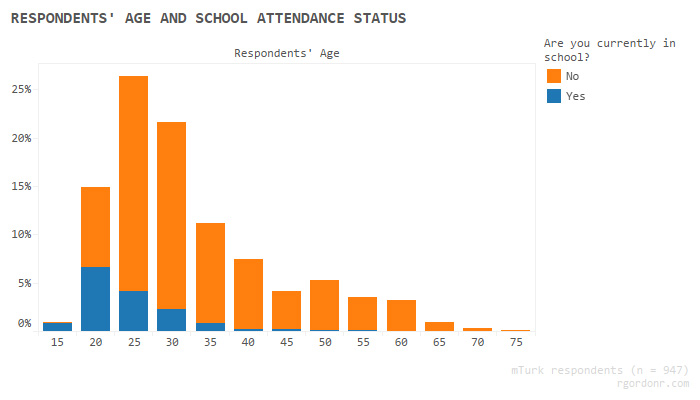
2) Age and parents' educational attainment
Consistent with other research, my sample of MTurk workers were generally quite young. Many were also still in school.
Standard measures for inferring SES may not be appropriate for the youngest, college-aged workers. Research relying on college students has instead inferred class from parents' SES backgrounds, and two important indicators of such SES are parents' educational attainment.
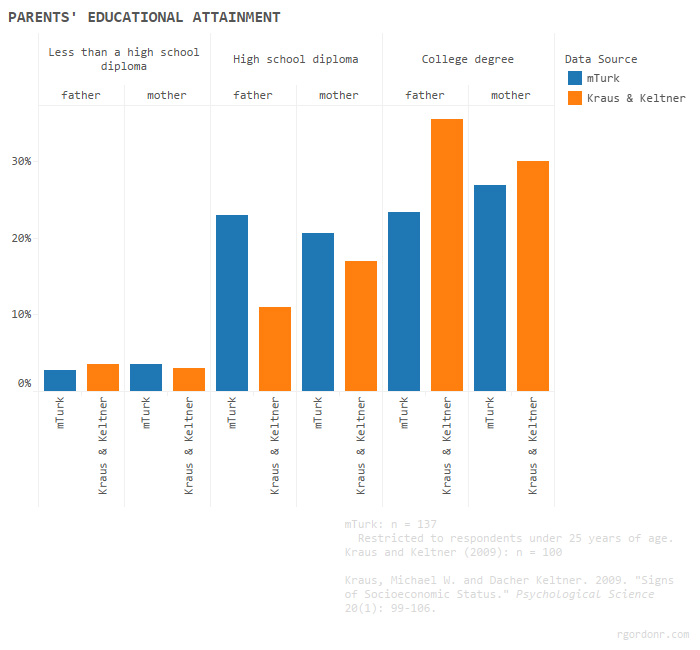
I restricted my analysis of parental educational attainment to respondents under 25 years of age. Although MTurk workers may be better educated than the average American, my sample of respondents were less likely than the public-university (probably Berkeley) sample used by Kraus & Keltner (2009) to come from a home where a mother or father had achieved a college degree.
3) Educational attainment and income
Consistent with other research, MTurk workers in my sample were, on average, highly educated.
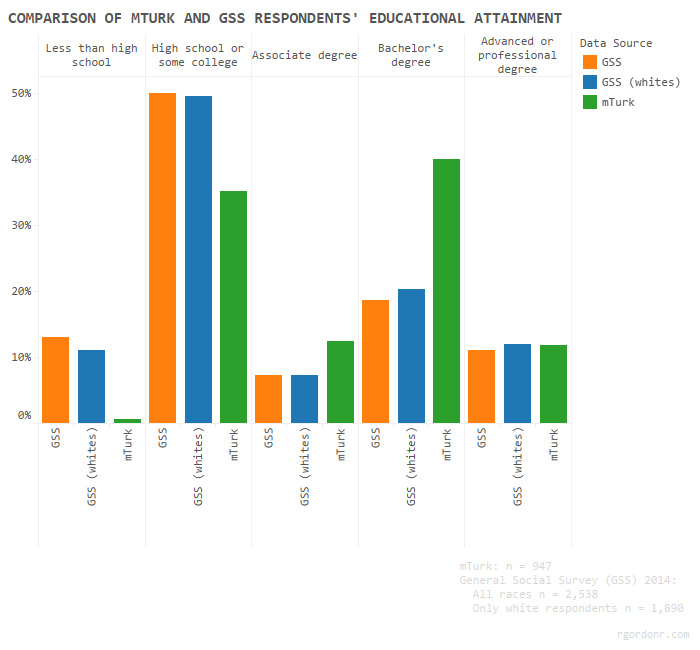
In addition to being well educated, my sample of MTurk workers also tended to be white (approximately 78% white, compared to the 2014 GSS sample being 74.5% white), and being white tends to correlate with higher educational attainment. However, the figure above shows that even after limiting the GSS sample to only white respondents, MTurk workers still tended to achieve much higher levels of educational attainment: relative to the average American, MTurk workers in my sample were far more likely to attain a bachelor's degree and far less likely to fail to attain at least a high school degree.
Although highly educated, these MTurk respondents tended to report lower levels of both personal and family income than are reported in the GSS.
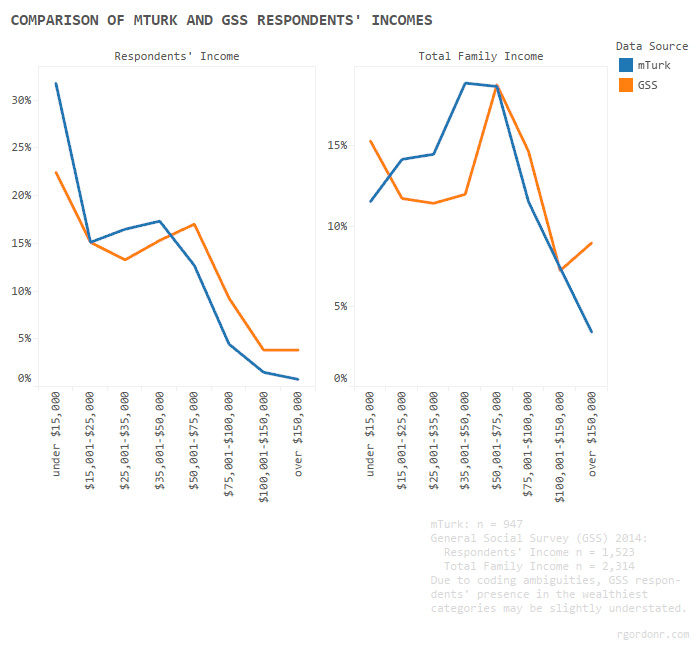
The differences were especially pronounced at the extremes: compared to GSS data, this sample of MTurk workers were much more likely to make under $15,000 and were also much less likely to report income in the high 5-figure range, while virtually no one reported income in the 6-figure range. These findings aren't surprising, however it's interesting that while these workers were more likely to be in the bottom of income earners, they were less likely than nationally representative figures to be members of families within the lowest income category.
4) Employment status
MTurk has been characterized as recourse for the unemployed, but how many MTurk workers rely solely on MTurk for their income, or have recently experienced employment instability?
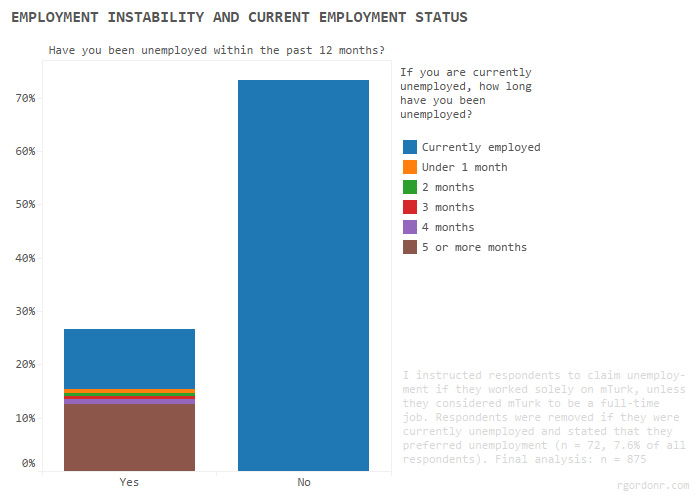
The majority of MTurk respondents did not report experiencing any recent employment instability, and the vast majority reported being currently employed (however, some may have considered MTurk to be a full-time job). Although I cannot make a perfect comparison to BLS figures with these responses (even after removing those who preferred unemployment), it is still worth noting that the unemployment rate of workers in my sample (12.6%) was much higher than the U.S. national average (5.4%, at the time of data collection). What's especially interesting are the “long-term unemployed.” BLS defines long-term unemployment as being jobless for 27 weeks and reports that such workers make up 29% of the unemployed population. Although the longest unemployment category these MTurk respondents could report was 20 weeks, it is still worth noting that these unemployed workers consisted of up to possibly 85% long-term unemployed. While not a perfect comparison, it is still clear that there were many MTurk workers in my sample suffering through an extended period of joblessness.
Conclusion
I've been hesitant to make any strong claims about MTurk workers beyond those in my sample. My data were not randomly sampled and cannot accurately predict population parameters. Knowing such exact figures are fairly unimportant here, though; one of the biggest advantages of MTurk is that you can sample based on the characteristics you desire. My main interest was to see who was missing — what kinds of SES backgrounds might we be unable to find on MTurk, even if we seek them out? The rarest respondents are those at the extreme end of the social scale, especially the top. Few respondents identified as upper class, saw themselves at the top of the social scale, or were members of families making over $150,000 a year. None of this is especially surprising. However, there may also be fewer people at the bottom of the social scale than it first appears, or at least fewer that are similar to the lower class surveyed by the GSS.
Among this MTurk sample, 34% of those in the lower class had gained at least some college education, and 26% had earned a Bachelor's degree. Only a little under 5% failed to attain a high school degree, compared to the approximately 36% of lower-class respondents in the GSS who reported achieving less than 12 years of education. Although better educated, these lower-class, MTurk respondents tended to be less well off financially than the lower class in general. This economic hardship among the MTurk lower class was partly explained by nearly half of lower-class respondents currently being unemployed.
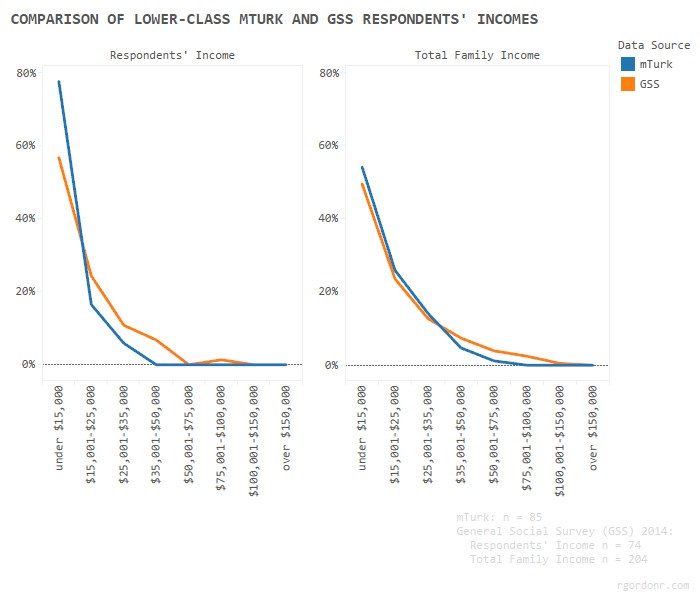
The lower class on MTurk appears to be much different than the broader lower class. Given their lower income, these MTurk respondents may have lower life chances, though they may benefit from their education later in life. Their high educational attainment may also manifest in cultural differences compared to the broader lower class. 4 However, it's difficult to make any predictions about those experiencing such an unusual combination of high education and poverty.
Just as you likely won't find the wealthiest of Americans on MTurk, you also won't find the least educated. However, you will still find significant diversity in MTurk works' subjective and objective class backgrounds. You'll just need to decide ahead of time the sort of characteristics you need to seek out, or you might end up with a sample consisting largely of young, middle-class whites.
-
Between April and May, 2015, five studies collected data from 1,087 respondents (I removed a small number of additional respondents due to failed attention checks). However, there were only 947 unique workers in this combined dataset. 103 workers participated in two studies, 15 workers participated in three studies, 1 worker participated in four studies, and 1 worker participated in all five studies. Only the earliest responses were included in my analyses, leaving the total number of usable respondents at 947. All studies were restricted to U.S. workers, and most studies required at least a 95% acceptance rate and at least 500 completed HITs. The respondents consisted of 44% women, 78% whites, and 5% blacks. ↩
-
Participants responded to a set of basic demographic questions (e.g., age, race, gender), and approximately half of respondents reported their occupations. Next, respondents answered the MacArthur SES Ladder, followed by a separate page where they indicated their class self-identification. Respondents then reported their educational attainment and whether or not they were currently in school, their parents' educational attainment, and then several questions related to current and recent employment status. Respondents' subjective class position did not appear to be impacted by first being asked to report their occupational background. ↩
-
e.g., subjective SES associates with various mental and physical health outcomes and negatively associates with attitudes toward redistributing wealth. ↩
-
see Chan and Goldthorpe (2007)'s discussion of the relationship between education and "omnivorous" cultural consumption. ↩